
Weekly Orders Chart Widget for WordPress Dashboard
This simple widget adds a clean weekly orders chart to your WordPress dashboard. It shows the last 7 days of order data with a line chart, summary statistics, and quick access to all orders.
What does this code do?
The snippet creates a dashboard widget that displays order trends for the past week using a simple line chart. It includes total orders, total revenue, and a direct link to view all orders.
Widget Features:
- Clean line chart showing 7-day order trend
- Summary stats: Total orders and revenue
- Hover tooltips with daily revenue info
- Direct link to WooCommerce orders page
- Responsive design for different screen sizes
- Lightweight Chart.js implementation
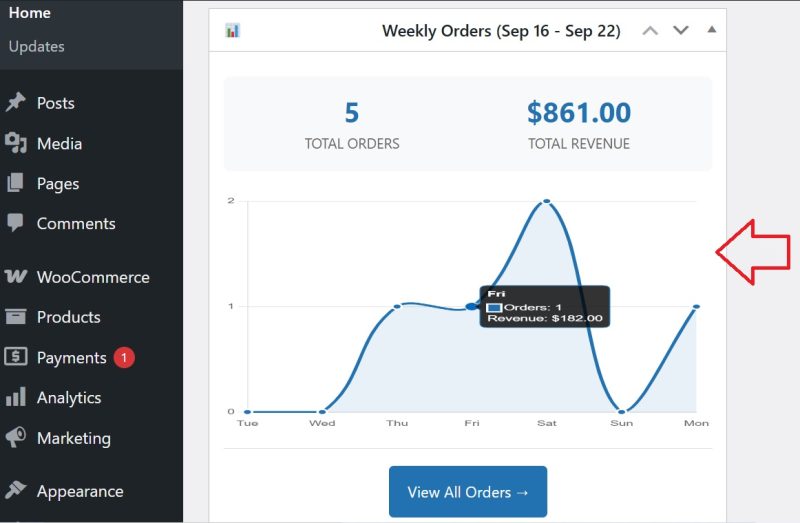
What you see:
- Top section: Total orders and revenue boxes
- Middle: Interactive line chart with daily data
- Bottom: “View All Orders” button
Chart details:
- Blue line with filled area underneath
- Shows last 7 days (Mon, Tue, Wed, etc.)
- Hover shows orders + revenue for each day
- Smooth curved line with highlighted points
Where it appears:
- WordPress Dashboard (wp-admin home page)
- Positioned at the top of widgets by default
- Visible to users with WooCommerce manage permissions
⚠️ Important Warnings
⚠️ Always backup before adding dashboard widgets⚠️ Requires WooCommerce to be active to show data
⚠️ Chart.js loads from CDN - needs internet connection
⚠️ Widget appears for all users with WooCommerce permissions
⚠️ Database queries run on every dashboard load
⚠️ Large order volumes might slow dashboard loading
⚠️ Clear cache if chart doesn't appear immediately
⚠️ Some browsers might block CDN resources
💻 PHP Code
/**
 * Simple weekly orders chart widget for WordPress dashboard
 * Shows last 7 days orders in a clean chart
 * Prefix: tpsc_ (TP Snippet Collection)
 */

// ============================================
// ADD DASHBOARD WIDGET
// ============================================

// Add widget to WordPress dashboard
add_action('wp_dashboard_setup', 'tpsc_add_weekly_orders_widget');
function tpsc_add_weekly_orders_widget() {
    // Generate date range for title
    $start_date = date('M j', strtotime('-6 days'));
    $end_date = date('M j', strtotime('today'));
    $widget_title = '📊 Weekly Orders (' . $start_date . ' - ' . $end_date . ')';

    wp_add_dashboard_widget(
        'tpsc_weekly_orders',
        $widget_title,
        'tpsc_weekly_orders_widget_content'
    );
}

// ============================================
// WIDGET CONTENT
// ============================================

// Widget content function
function tpsc_weekly_orders_widget_content() {

    // Check if WooCommerce is active
    if (!class_exists('WooCommerce')) {
        echo '<p>WooCommerce is not active.</p>';
        return;
    }

    // Get weekly data
    $weekly_data = tpsc_get_weekly_orders_data();

    echo '<div class="tpsc-widget-container">';

    // Summary stats
    echo '<div class="tpsc-summary">';
    echo '<div class="tpsc-stat">';
    echo '<span class="tpsc-number">' . array_sum($weekly_data['orders']) . '</span>';
    echo '<span class="tpsc-label">Total Orders</span>';
    echo '</div>';
    echo '<div class="tpsc-stat">';
    echo '<span class="tpsc-number">' . wc_price(array_sum($weekly_data['revenue'])) . '</span>';
    echo '<span class="tpsc-label">Total Revenue</span>';
    echo '</div>';
    echo '</div>';

    // Chart canvas
    echo '<canvas id="tpsc-weekly-chart" width="400" height="200"></canvas>';

    // View all orders link
    echo '<div class="tpsc-footer">';
    echo '<a href="' . admin_url('edit.php?post_type=shop_order') . '" class="button">View All Orders →</a>';
    echo '</div>';

    echo '</div>';

    // Hidden data for JavaScript
    echo '<script type="text/javascript">';
    echo 'var tpscWeeklyData = ' . json_encode($weekly_data) . ';';
    echo '</script>';
}

// ============================================
// DATA COLLECTION
// ============================================

// Get weekly orders data
function tpsc_get_weekly_orders_data() {
    $data = array(
        'labels' => array(),
        'orders' => array(),
        'revenue' => array()
    );

    // Get last 7 days
    for ($i = 6; $i >= 0; $i--) {
        $date = date('Y-m-d', strtotime("-{$i} days"));
        $day_name = date('D', strtotime("-{$i} days")); // Mon, Tue, etc.

        // Get orders for this date using WooCommerce functions (HPOS compatible)
        $orders = wc_get_orders(array(
            'status' => array('completed', 'processing', 'on-hold'),
            'date_created' => $date,
            'limit' => -1,
            'return' => 'ids'
        ));

        $orders_count = count($orders);
        $revenue = 0;

        // Calculate revenue
        foreach ($orders as $order_id) {
            $order = wc_get_order($order_id);
            if ($order) {
                $revenue += $order->get_total();
            }
        }

        $data['labels'][] = $day_name;
        $data['orders'][] = intval($orders_count);
        $data['revenue'][] = floatval($revenue);
    }

    return $data;
}

// ============================================
// STYLES AND SCRIPTS
// ============================================

// Add widget styles and scripts
add_action('admin_enqueue_scripts', 'tpsc_widget_assets');
function tpsc_widget_assets($hook) {

    // Only load on dashboard
    if ($hook !== 'index.php') {
        return;
    }

    // Chart.js (lightweight version)
    wp_enqueue_script('chartjs-mini', 'https://cdnjs.cloudflare.com/ajax/libs/Chart.js/3.9.1/chart.min.js', array(), '3.9.1', true);

    // Widget CSS
    wp_add_inline_style('wp-admin', '
        .tpsc-widget-container {
            padding: 10px 0;
        }

        .tpsc-summary {
            display: flex;
            justify-content: space-around;
            margin-bottom: 20px;
            padding: 15px;
            background: #f8f9fa;
            border-radius: 6px;
        }

        .tpsc-stat {
            text-align: center;
        }

        .tpsc-number {
            display: block;
            font-size: 24px;
            font-weight: bold;
            color: #2271b1;
            line-height: 1.2;
        }

        .tpsc-label {
            display: block;
            font-size: 12px;
            color: #666;
            margin-top: 5px;
            text-transform: uppercase;
        }

        #tpsc-weekly-chart {
            width: 100% !important;
            height: 200px !important;
            margin: 10px 0;
        }

        .tpsc-footer {
            text-align: center;
            margin-top: 15px;
            padding-top: 15px;
            border-top: 1px solid #ddd;
        }

        .tpsc-footer .button {
            background: #2271b1;
            color: white;
            text-decoration: none;
            border: none;
            padding: 8px 16px;
            border-radius: 4px;
            font-size: 13px;
        }

        .tpsc-footer .button:hover {
            background: #135e96;
            color: white;
        }
    ');

    // Widget JavaScript
    wp_add_inline_script('chartjs-mini', '
        // Initialize chart when page loads
        document.addEventListener("DOMContentLoaded", function() {
            tpscInitWeeklyChart();
        });

        function tpscInitWeeklyChart() {
            // Check if data and canvas exist
            if (typeof tpscWeeklyData === "undefined") return;

            const canvas = document.getElementById("tpsc-weekly-chart");
            if (!canvas) return;

            // Create the chart
            new Chart(canvas, {
                type: "line",
                data: {
                    labels: tpscWeeklyData.labels,
                    datasets: [{
                        label: "Orders",
                        data: tpscWeeklyData.orders,
                        borderColor: "#2271b1",
                        backgroundColor: "rgba(34, 113, 177, 0.1)",
                        fill: true,
                        tension: 0.4,
                        pointRadius: 4,
                        pointHoverRadius: 6,
                        pointBackgroundColor: "#2271b1",
                        pointBorderColor: "#fff",
                        pointBorderWidth: 2
                    }]
                },
                options: {
                    responsive: true,
                    maintainAspectRatio: false,
                    scales: {
                        y: {
                            beginAtZero: true,
                            ticks: {
                                stepSize: 1,
                                font: {
                                    size: 11
                                }
                            },
                            grid: {
                                color: "rgba(0,0,0,0.1)"
                            }
                        },
                        x: {
                            ticks: {
                                font: {
                                    size: 11
                                }
                            },
                            grid: {
                                display: false
                            }
                        }
                    },
                    plugins: {
                        legend: {
                            display: false
                        },
                        tooltip: {
                            backgroundColor: "rgba(0,0,0,0.8)",
                            titleColor: "#fff",
                            bodyColor: "#fff",
                            borderColor: "#2271b1",
                            borderWidth: 1,
                            callbacks: {
                                afterBody: function(context) {
                                    const index = context[0].dataIndex;
                                    const revenue = tpscWeeklyData.revenue[index];
                                    return "Revenue: $" + revenue.toFixed(2);
                                }
                            }
                        }
                    },
                    interaction: {
                        intersect: false,
                        mode: "index"
                    }
                }
            });
        }
    ');
}

// ============================================
// WIDGET POSITIONING
// ============================================

// Move widget to top (optional)
add_action('wp_dashboard_setup', 'tpsc_reorder_dashboard_widgets');
function tpsc_reorder_dashboard_widgets() {
    global $wp_meta_boxes;

    // Get current user
    $user_id = get_current_user_id();

    // Check if user wants widget on top
    $widget_order = get_user_meta($user_id, 'meta-box-order_dashboard', true);

    if (empty($widget_order) || !isset($widget_order['normal'])) {
        // Set our widget first in the normal column
        $wp_meta_boxes['dashboard']['normal']['core'] = array(
            'tpsc_weekly_orders' => $wp_meta_boxes['dashboard']['normal']['core']['tpsc_weekly_orders']
        ) + $wp_meta_boxes['dashboard']['normal']['core'];
    }
}
📝 Installation Instructions
QUICK START:Copy the entire code
Paste in functions.php
Go to WordPress Dashboard (wp-admin)
See your weekly orders widget with chart!
WIDGET POSITIONING:
The widget appears at the top by default.
To change position, users can drag it around the dashboard.
PERMISSIONS:
Widget shows for users who can manage WooCommerce.
To change permissions, modify the dashboard widget registration.
CUSTOMIZING COLORS:
Chart color (blue): Find borderColor: "#2271b1"
Background fill: Find backgroundColor: "rgba(34, 113, 177, 0.1)"
Change to different colors:
Green: "#27ae60" and "rgba(39, 174, 96, 0.1)"
Red: "#e74c3c" and "rgba(231, 76, 60, 0.1)"
Orange: "#f39c12" and "rgba(243, 156, 18, 0.1)"
CHANGING TIME PERIOD:
To show different period, find the loop:
for ($i = 6; $i >= 0; $i--) // 7 days
Change to:
for ($i = 13; $i >= 0; $i--) // 14 days
for ($i = 29; $i >= 0; $i--) // 30 days
CHART TYPE:
To change from line to bar chart:
Find: type: "line"
Change to: type: "bar"
REMOVING REVENUE FROM TOOLTIP:
To show only orders in hover, remove this section:
callbacks: {
afterBody: function(context) {
// Remove this entire function
}
}
STYLING SUMMARY BOXES:
To change the summary box colors:
Find: background: #f8f9fa;
Change to: background: #e3f2fd; (light blue)
MOVING WIDGET:
Users can drag the widget to different positions.
To force a specific position, modify the tpsc_reorder_dashboard_widgets function.
HIDING FOR SPECIFIC USERS:
To hide from certain users, add this check in the widget function:
if (!current_user_can('administrator')) {
return; // Only show to admins
}
TESTING:
Ensure WooCommerce is active
Have some orders in the last 7 days
Check WordPress Dashboard
Verify chart displays correctly
Test hover tooltips
Click "View All Orders" link
📸 Screenshots
×
![]()
1 / 1
💬 Let's Connect and Share!
Got a question about this snippet?
Something not working as expected? Need help customizing it for your specific needs?
Want to request a custom snippet?
Have an idea for functionality you're missing on your site? Tell us what you're looking for!
Have an awesome snippet you're using?
Share it with us! Our community loves learning and growing together.
No comments yet.